More Cache Craziness
I’ve written before about the importance of cpu cache efficient algorithms. This is yet another adventure in that world. First, however, let’s start with a simple cache quiz: which code is faster?
/* going vertical */
for (x=0;x<width;x++)
for (y=0;y<height;y++)
a[y*width+x] = b[y*width+x] + c[y*width+x]
/* going horizontal */
for (y=0;y<height;y++)
for (x=0;x<width;x++)
a[y*width+x] = b[y*width+x] + c[y*width+x]
The second one. Right? Every programmer knows that the second is faster, and they know why (I hope). A simple matrix addition is simple enough that we can “reason” our way into which is theoretically faster without actually trying it. I recently ran a much more complex example of a similar problem.
The problem: For face recognition, it is often necessary to compute a huge face similarity matrix. Face X compared with face Y returns a score Z. We place Z at (X,Y). It’s a fairly straightforward output to a huge comparison between two sets of faces. The naive method would look very similar to the matrix adds at the top. You start in the upper left corner, do the entire first row, one by one, and then move onto the second row, etc.
The hypothesis: If we break the computation into sub-blocks, it will more effectively use cache and thus be faster. As an example, for a 1000×1000 comparison, the naive method would do all 1000 comparisons in the first row, then 1000 more for the second, and so on. The block method would break the computation into, for example, 100×100 blocks. By only using these sub-blocks, it allows you to use the same input faces more frequently and thus, hopefully, more cache efficiently.
So let’s try it
I took the 20 required minutes, randomly picked a block size (I think it was on the order of 50×50), and lo and behold, it was substantially faster than the naive method. Alright. Now, how do I go about finding a good block size? Unlike our matrix addition example, this is a tough answer to reason your way towards, so I decided to play around to build up some intuition for the problem.
Does block area matter?
Yes, it matters. 2×2 blocks are just too small. There’s too much overhead introduced by breaking the problem into that many blocks (especially with threading enabled). There needs to be enough “meat” in the blocks to make it worth your while.
Are square blocks best?
It seemed like a logical question. It took almost no time for me to figure out that absolutely not, square blocks were not better. The very first test I ran was something along the lines of 50×50 blocks versus 25×100 blocks. The 25×100 blocks crushed the 50×50 blocks. Interesting.
How about the direction of travel?
Which was faster 10×40 or 40×10? Turns out 10×40 was substantially faster than 40×10. This is getting confusing. I spent another hour playing with numbers and eventually came to the conclusion that putting the smallest dimension in the horizontal direction made it faster. Inside the inner function, if a block size comes in that doesn’t follow this rule, I switched them (so if you asked for a block size of 40×10, you got 10×40).
Time to stop screwing around
I was about 2 hours into this little adventure when I realized there was absolutely no way I was going to meander to the right answer. This wasn’t a simple problem. The only solution was my old friend science. Let’s actually run the experiment and see what happens. I picked 16 different lengths ranging from 2 to 1000, and ran every permutation of block sizes and graphed the results. Here’s what it looked like: 
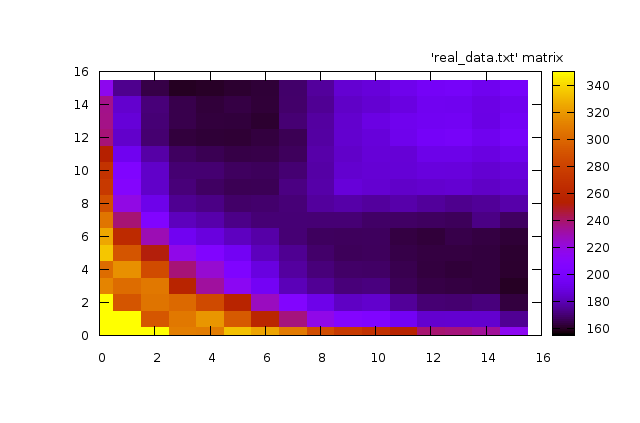
This graph is just so cool. Let me explain what you are looking at. It’s a 2d plot in a heat-graph format. The darker the color, the faster the code ran. The position in the grid represents the block size. As we travel right along the graph, we are increasing the longer dimension and as we travel upward along the graph, we are increasing the shorter dimension. The diagonal from bottom-left to top-right, then, is the square block sizes. The graph is also symmetric because of the rule I put in to ensure the longer dimension is always height (explained above). This graph has three interesting features:
- The extremely “hot” (slow) region hugging the bottom and the left axes. This region is when one (or both) dimensions is extremely small. With extremely small windows, there’s too much overhead (especially with threading) and it begins to dominate the actual computation.
- The bizarre rectangle in the upper-right. More on this in a second.
- The sweet-spot dark regions that essentially correspond to extremely long and fairly skinny rectangles.
Making Sense of it All
That rectangle in the upper right perplexed me and so I showed it around. Someone at the office had a conjecture that sounded plausible (versus my previous theory of plain old black magic). For small widths, the entire horizontal input is able to be cached. As you grow the width, eventually you reach a point where the horizontal input no longer fits, and by the time you start on the next row of the block, the first input is largely gone. In other words, my little graph shows quite clearly the moment that our block blows up our cache.
That particular theory meant, then, that the point where the block was “too” wide depended heavily on the machine and the environment the process was running. Since I didn’t want to tune too much to a single machine, I thought it wise to avoid going anywhere near that line.
My final block-size selection algorithm looks something like this: Use as tall a rectangle as is reasonable, make it as skinny as possible such that you ensure there is enough area to drown out threading overhead.
Measure. Measure. Measure.
At the end of the day, you can pretty much “explain” any cache behavior, once you’ve seen it. You can find a plausible reason why certain things make the code run faster. Maybe in hindsight your explanation will even makes sense. Its become obvious to me, however, that for any non-trivial problem, you positively need to rigoriously experiment.
March 16th, 2009 at 11:45 am
Wouldn’t that graph scale differently for different cache sizes as well? Also, possibly for different ratios of L1/L2/L3 cache. It would be interesting to see if the amount of data that “8″ corresponds to on your axes aligned with the approximate size of your L1 or L2 cache. This idea is probably way too much over-optimization but it would be interesting to find out if you can query the CPU for its cache size and make the algorithm dynamic based on that.
Interesting stuff, thanks for sharing it.
-Dave
March 17th, 2009 at 8:56 am
Absolutely. I am certain that line is a function of the cache on the machine. In fact, I did some back of the envelope calculations and believe the 8 axis line corresponds roughly to the L2 cache.
March 18th, 2009 at 5:01 am
Do you mean: “As we travel right along the graph, we are increasing the OUTER LOOP dimension and as we travel upward along the graph, we are increasing the INNER LOOP dimension.”? Or somthing similar?
How can the “shorter” dimension have a higher value on the graph than the “longer” dimension (top left of graph)?
In any case, very nice analysis.
March 18th, 2009 at 10:17 am
Very cool post. Hit this from DZone and glad I stopped by!
March 18th, 2009 at 12:25 pm
Kyle,
I knew that part would be confusing. Before I made that graph, I inserted code that ensured the smaller dimension was always the horizontal dimension (which is also the inner loop). In other words, if you ask for 40×10, a little check would trigger and instead do 10×40. That forced the graph to be symmetric and also a bit confusing.
(note: it’s not -actually- symmetric because the test ran both 10×40 and 40×10. The little check triggered and essentially did 10×40 twice, resulting in the two halves being similar but not identical).
Louis
March 18th, 2009 at 12:42 pm
This is a great topic! In addition to memory layout issues, algorithms themselves can behave differently when caching is taken into account. Researchers at the University of Washington looked pretty deeply into this issue in the mid 90’s, and came up with some surprising results. I think one such result is that Mergesort can be asymptotically faster than Quicksort, when caching is accounted for. This is one of those cyclic times — these same issues were paramount when main memory was in the kilobytes, and the community talked about “external” algorithms, meaning ones that explititly staged data between mass storage into RAM.
Here are some papers to check out on the topic:
http://portal.acm.org/citation.cfm?id=314324
http://portal.acm.org/citation.cfm?id=923788
http://people.reed.edu/~jimfix/papers/fix-soda03.pdf
March 19th, 2009 at 5:12 am
Hello,
Please add your site at http://www.sweebs.com. Sweebs.com is a place where other people can find you among the best sites on the internet!
Its just started and we are collecting the best found on the net! We will be delighted to have you in the sweebs listings.
Regards
Kris
March 19th, 2009 at 1:34 pm
Louis,
Oh! That would explain the reflective symmetry over the x=y line. May you run the same without sorting the width and height?
Thanks
March 31st, 2009 at 1:08 am
Have you looked at the emitted code? Loop unrolling may be a contributing factor as to why small horizontal widths run faster.
March 31st, 2009 at 2:43 am
This is very cool. I’m a big fan of strong debugging/profiling tools (I spent 10-20% of my time on these alone), as I find the longer you spend on these, the less time you spend fixing bugs and tweaking parameters (or you can hand these over to colleagues to fine tune as required).
Outputting the performance as a heat graph is a great idea, which I might “harvest” in the future. I sit wondering how many hours of reading text output you saved yourself there!
March 31st, 2009 at 3:01 am
Ever heard about whitespaces? IMHO your code is horrible to read. Make it readable, only then start optimizing.
March 31st, 2009 at 3:06 am
> Every programmer knows that the second is faster, and they know
> why (I hope)
Maybe you should just answer the “why” to make this article reach out to a wider audience.
BTW, trying out the analysis on CPU’s with different architectures might be fun…
March 31st, 2009 at 5:25 am
For science’s sake, could you re-generate that heatmap without the swap-x-and-y rule?
> Which was faster 10×40 or 40×10? … This is getting confusing.
So why not test and confirm your hypothesis, instead of baking the bias in?
March 31st, 2009 at 7:18 am
Fascinating. Very good points indeed!
RT
http://www.privacy.at.tc
March 31st, 2009 at 8:01 am
Hi Louis,
Thanks for the interesting article, again. You are diving into some very interesting work, the idea of cache blocks has been around for awhile, it’s surprising that standard matrix libraries all still interact with lexicographically ordered matrices reduced to 1 dimension.
I too am curious about how you unrolled your blocks. It’s important to use compile-time constant loop sentinels (height and width in your example) if you want the best performance from your code. Also, the compiler really does matter here.
One final note, a very similar graph is in Computer Systems: A Programmer’s Perspective, Bryant and O’Hallaron liked it so much they put it on the cover!
March 31st, 2009 at 8:06 am
Am I missing something,or does it seem that the graph is symmetric about the 45 degree line y=x? Which would imply, contradicting your first point, that it doesn’t matter whether you go lengthwise or widthwise in the outer loop?
March 31st, 2009 at 8:15 am
@brendan,
It is symmetric because I explicitly swap them to ensure that the inner loop is the smaller of the two dimensions. I agree this makes it confusing.
@kk, brendan, and others,
The graph was produced for my own internal purposes and has been repurposed here. I wish I could go back and generate a less confusing one (one that is not symmetric) for the purposes of this blog. However, it would take a fair bit of time to dig back into it and run the experiments.
Before I committed these changes, I actually worked fairly hard to demonstrate that the dimension swapping rule did increase performance. I didn’t go into great detail above because it would have made this post a fair bit longer and it would have lacked pretty pictures.
March 31st, 2009 at 8:59 am
Read about FFTW, a system that tested the hardware to determine how to automatically reorganize their FFTs to run fast. Cache effects were a significant part of it. This was at MIT in the early ’90s.
March 31st, 2009 at 9:03 am
Nice work. Is the graph normalized for the size of the matrix? A 10×10 matrix has 100 members and is clearly in the upper-right slow zone. A 6×16 matrix has 96 members and it’s pretty much on the edge of the slow zone. The middle of the fast zone is 4×16, but that’s only 64 members.
March 31st, 2009 at 10:26 am
Is it fair to say there’s a factor of two difference between the best and naive block sizes?
Any intuition about why putting the small dimension on the horizontal was better? The horizontal corresponds to contiguous memory, right? So the amount of memory that has to be cached on one row is x_dim * sizeof(face), which is invariably much larger than y_dim.
Also, I suspect there are more gains to be had with a more general permutation of the x,y pairs that takes into account which faces should be in the cache based on the recent history. That is, you should be able to, with a small overhead, guess which unevaluated pairs can be computed at any given time without a cache miss, and evaluate those. Conceivably some attention to timing numbers from early calculations would allow you to infer the cache geometry on the fly without any cpu-specific tuning.
March 31st, 2009 at 10:32 am
Why on earth would you constrain “the longer dimension is always height” before you plotted this graph? I’m sorry, but that makes no sense.
You gain nothing by constraining that when you run this experiment, and it’s possible you threw away a surprising local minima.
March 31st, 2009 at 10:45 am
On the x=y symmetry issue,
Let me see if I can summarize what I’ve said previously at the issue, to help it “make sense” to those of you who keep insisting it doesn’t:
1. I didn’t make an arbitrary constraint and then start taking data. I didn’t “throw away a surprising minima”. I just don’t have the charts from earlier experiments.
2. I agree its confusing and sub-optimal but it still gets the point across. I wish I had the data from the previous experiments, but I didn’t keep it. I have shown you what I have available.
3. My first priority is actually getting things done, not writing blog posts. The idea to write it up came after the fact and I only had what I had. Rerunning the tests to get the data I lost is possible, but expensive. I could photoshop it from memory, if you’d prefer.
4. I waived my hand at the full list of things I’ve done to convince myself of these facts because I didn’t want this post to triple in length. There were many, many, many more issues in play than just this that I’ve also ignored for the sake of conciseness.
I tried to convey the most interesting part of the problem in a reasonably concise manner. I apologize that I don’t have the full experiment or the full writeup. I’m sorry I had to waive my hand at one of the central conclusions because I don’t have the data nor the time to reproduce it.
I understand that is frustrating but it is what it is. Watching cache pop in a graph is interesting to me, so I shared it.
March 31st, 2009 at 11:43 am
If you are on i86, you might want to look at assembly, especially the prefetch instructions and non-temporal stores. Your program could run anywhere from 10 to 100 times faster than what you have there. You should prefetch about 3 times the L1 cache line size. You can experiment and see what gives the best results.
March 31st, 2009 at 12:58 pm
Time to go cache-oblivious? (Has some links to other algorithms) http://blogs.msdn.com/devdev/archive/2007/06/12/cache-oblivious-data-structures.aspx
March 31st, 2009 at 2:33 pm
You mentioned towards the end you didn’t want to get too specific per machine. If you’ve already written the code to determine what works well on a specific architecture like you have, why not employ that to fine tune exactly for the machine you’re on?
March 31st, 2009 at 3:28 pm
Matt,
We are writing an SDK we want to distribute. While we could try to make it automagic, it has a high cost and a low benefit. We don’t lose much by staying far away from the maximal size, but it requires a great deal of engineering and a fair bit of assumptions (like what else might be running on a particular machine).
March 31st, 2009 at 4:48 pm
@louis Ahh that makes sense, that wasn’t clear from the article. I do a lot of server side web programming so I guess my assumption was it was an algorithm on your machines. Thanks for the answer.
March 31st, 2009 at 6:15 pm
I had done some research on these sorts of effects in the late 90s (peers with the FFTW work). I love your ending line where you state: “Its become obvious to me, however, that for any non-trivial problem, you positively need to rigoriously experiment.” That was a realization that I also learned. And if you have low associative caches then the unpredictability becomes really pronounced. I built a system that helped automate the process of building these sorts of algorithms, although it never had wide use.
Anyways here’s a link to the work, if you’re interested:
http://www.cs.ucsd.edu/~kgatlin/papers/thesis.pdf
Thanks for the interesting read.
April 1st, 2009 at 5:52 am
Very interesting analysis, thanks for the graphs!
It is probably worth investigating using optimized BLAS libraries for your matrix calculations, for example the Intel MKL will automatically multithread the matrix operation when it is optimal to do so, and will use the SSE vector processing units. Generally you can expect a significant speedup (2-10x) over handmade code. You can distribute the MKL libs along with your SDK, the license encourages that (e.g. Matlab comes with the MKL as its default BLAS now). Also, using the MKL means you’ll automatically take advantage of any new vector processing hardware (e.g. AVX) when it comes available, so you don’t have to keep revisiting your code.
April 1st, 2009 at 11:53 am
Nice article. What did you use to do the heat plot?
April 1st, 2009 at 12:19 pm
justinhj,
gnuplot
April 9th, 2009 at 10:35 pm
I recently came across your blog and have been reading along. I thought I would leave my first comment. I don’t know what to say except that I have enjoyed reading. Nice blog. I will keep visiting this blog very often.
Betty
http://laptopprocessor.info